
September delivered the first clear picture of the fall real estate market across Montclair and Northern New Jersey—and the story is more nuanced than a simple shift from “hot” to “cool.”
After an exceptionally competitive spring and a strong summer, inventory increased in several towns, some homes took longer to sell, and the premiums above asking became less dramatic. At the same time, average sale prices remained above September 2025 levels throughout the markets reviewed.
The market is not moving in one direction everywhere. Montclair, Maplewood, South Orange, Bloomfield, Livingston, Summit, Chatham Township, Short Hills and Millburn are each following their own path.
That is why real estate is not merely local. It is hyperlocal.
Montclair: More Inventory, More Sales Year Over Year—and Greater Buyer Selectivity
Montclair entered the fall with noticeably more inventory and a slower pace than we saw during the summer.
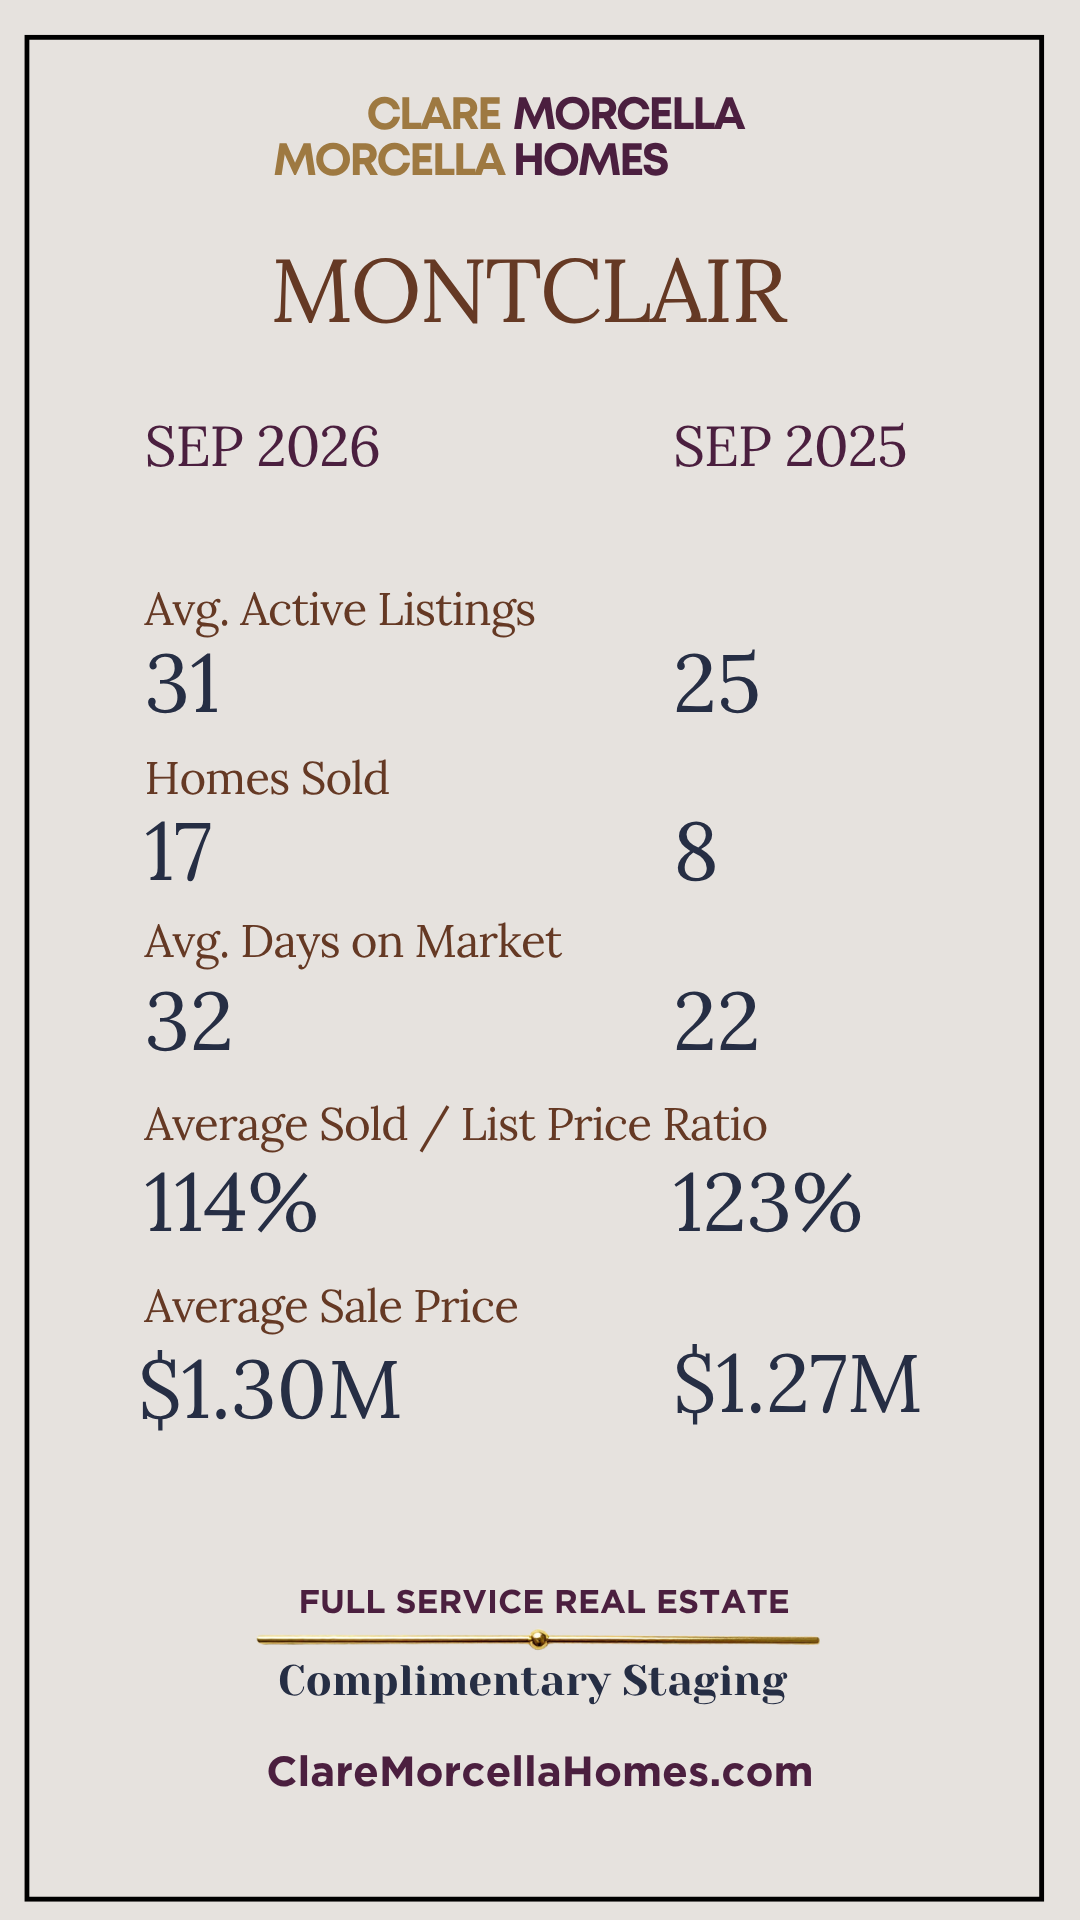
In September 2026:
- Average active listings: 31
- Homes sold: 17
- Average days on market: 32
- Average sale-to-list price ratio: 114%
- Average sale price: $1.30 million
The contrast with August is significant. Montclair had averaged just 13 active listings in August, when 31 homes sold in an average of 17 days and achieved 125% of their asking prices. The average sale price was $1.67 million.
By September, buyers had more choices, sales volume had declined from the unusually active August level, and homes were taking longer to sell. The average premium over asking also narrowed from 25% to 14%.
However, that does not mean Montclair’s market suddenly became weak.
Compared with September 2025, the number of sales more than doubled—from 8 to 17—and the average sale price increased from $1.27 million to $1.30 million. Inventory rose from 25 to 31 homes, while the average sale-to-list ratio moved from 123% to 114%.
The September results suggest that buyer demand remains substantial, but the competition is no longer equally intense for every property.
A thoughtfully prepared, professionally staged and strategically priced Montclair home can still attract strong interest. Buyers are simply becoming more discerning about which homes justify an aggressive offer.
Maplewood: Limited Inventory Continues to Support Prices
Maplewood remained competitive in September, with homes selling quickly despite a modest decline in the average sale-to-list ratio.
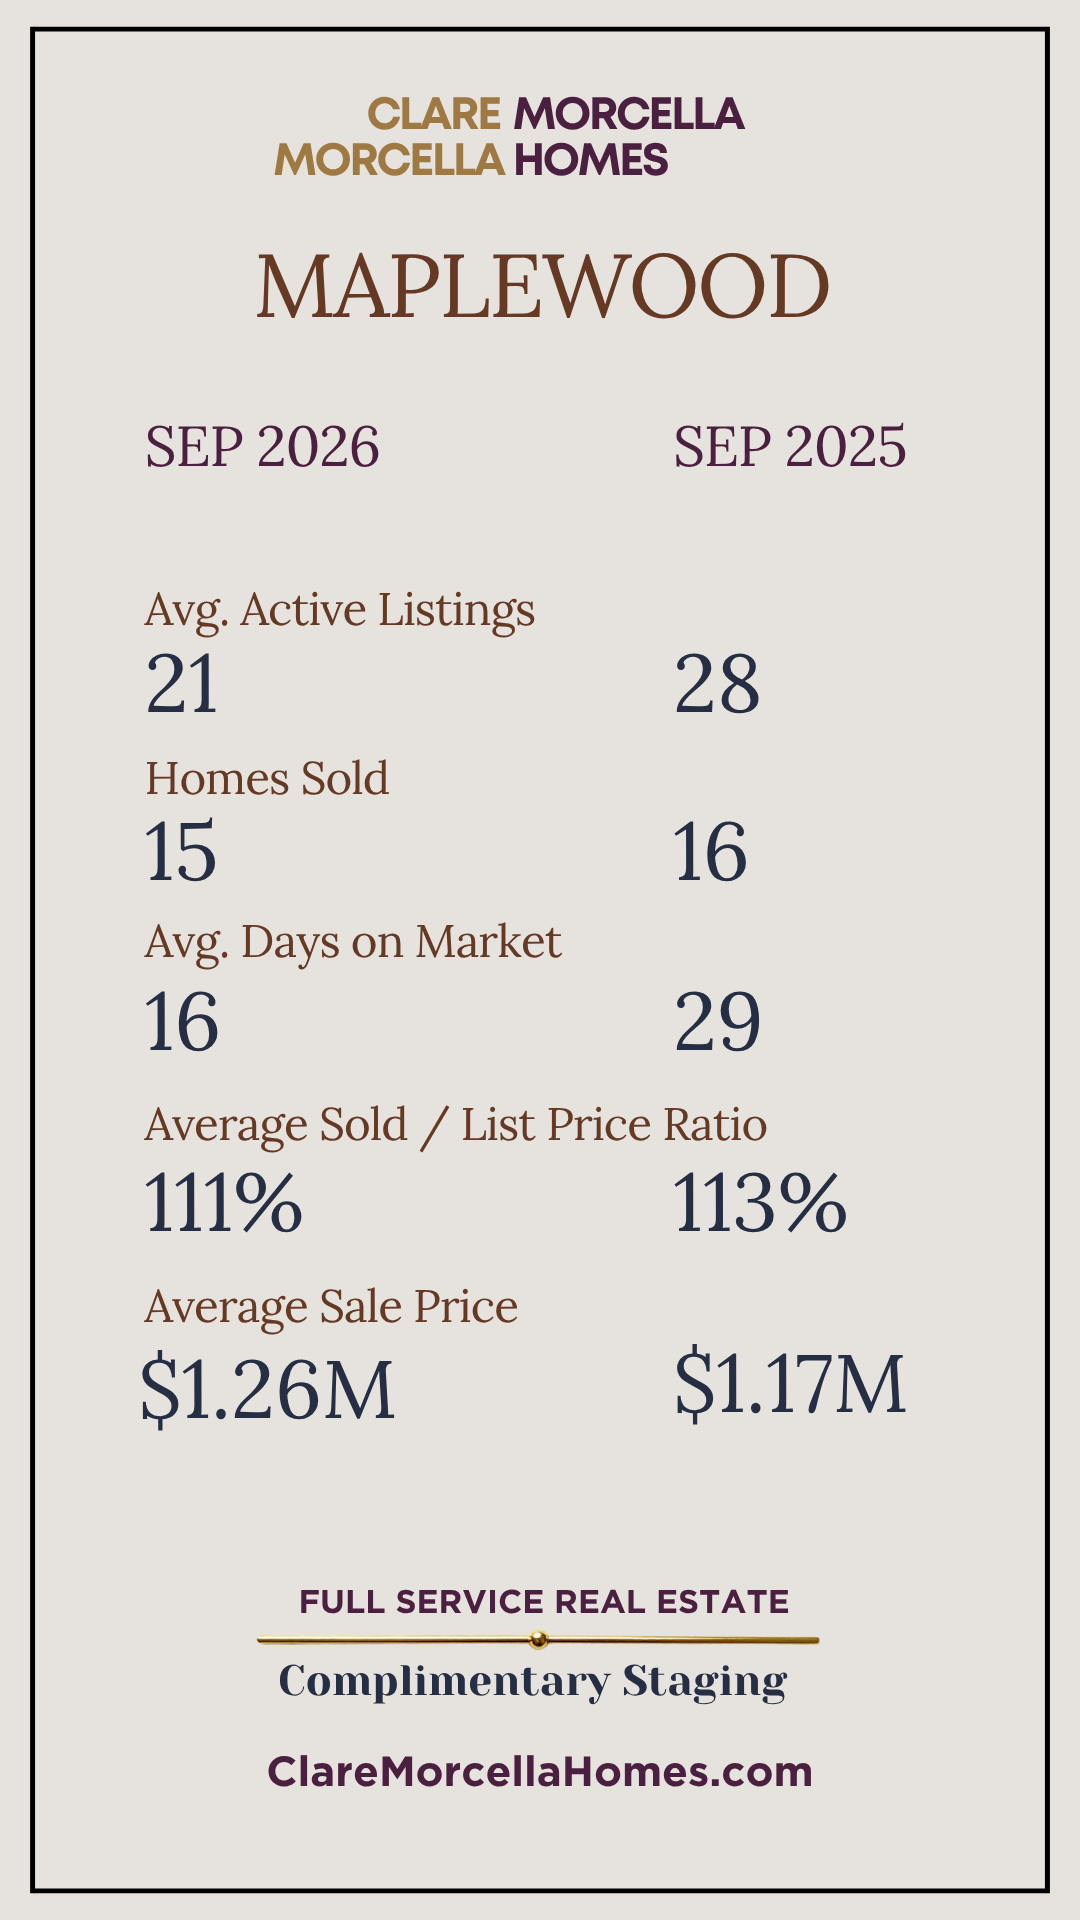
September 2026 recorded:
- 21 average active listings
- 15 sales
- 16 average days on market
- 111% average sale-to-list price ratio
- $1.26 million average sale price
Compared with September 2025, inventory declined from 28 to 21 homes, while average market time improved substantially from 29 to 16 days. The average sale price increased from $1.17 million to $1.26 million.
The number of sales was nearly unchanged—15 compared with 16 last year—while the average sale-to-list ratio eased from 113% to 111%.
Compared with August 2026, when Maplewood’s average sale price was approximately $1.38 million and homes averaged 115% of asking, September was less intense. Even so, an average sale at 111% of list price remains a strong seller-market result.
Maplewood illustrates an important point: a market can become more selective without becoming unfavorable to sellers. Limited supply is still supporting prices, but buyers are becoming more measured when deciding how far above asking they are prepared to go.
South Orange: Prices Held Steady While Competition Moderated
South Orange’s average sale price remained remarkably stable year over year.
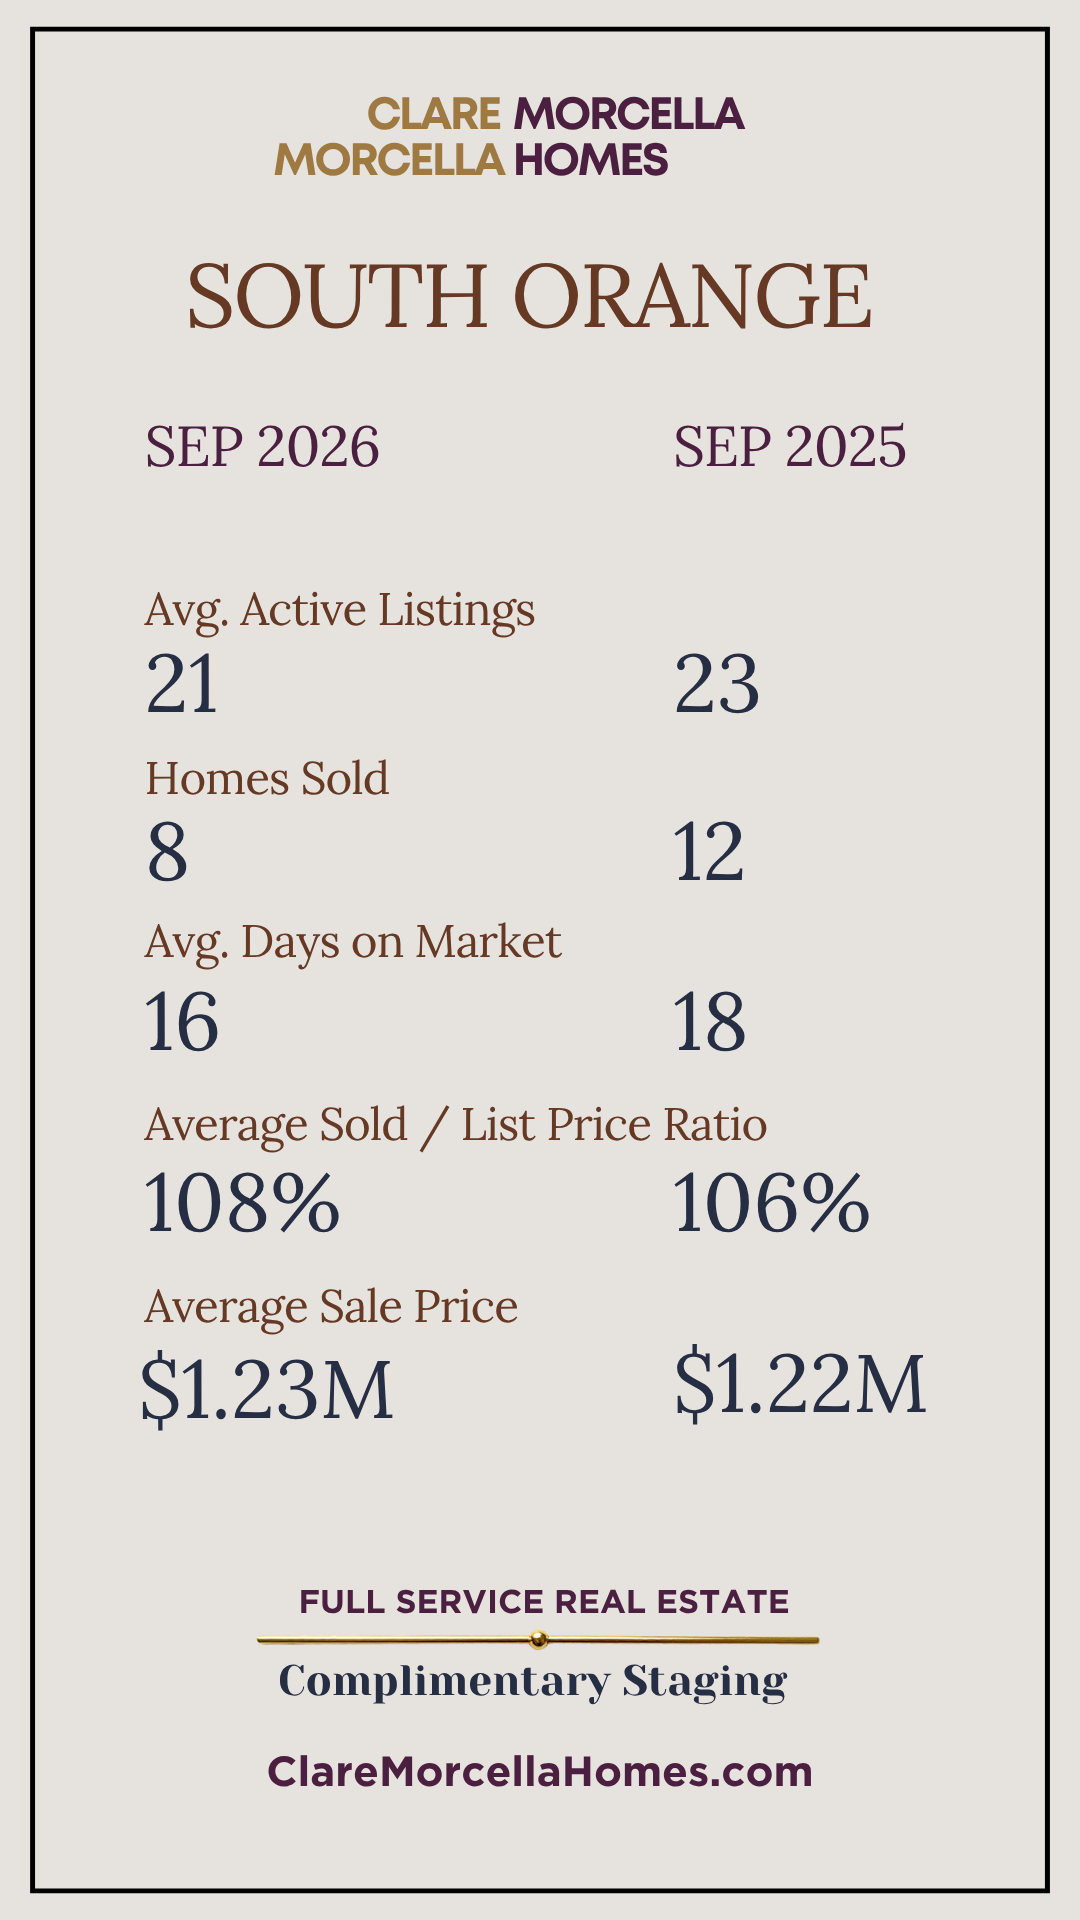
In September 2026:
- Average active listings: 21
- Homes sold: 8
- Average days on market: 16
- Average sale-to-list price ratio: 108%
- Average sale price: $1.23 million
In September 2025, 12 homes sold at an average price of $1.22 million. Homes averaged 18 days on the market and achieved 106% of asking.
This year, sales volume was lower, but homes sold slightly faster and achieved a higher percentage of their asking price.
Compared with August 2026, the average sale price remained relatively steady, moving from approximately $1.21 million to $1.23 million. The average sale-to-list ratio, however, declined from 117% to 108%.
That change indicates less extreme competition, but it does not signal the disappearance of demand. South Orange homes still sold above asking on average, and the September market remained favorable to sellers whose properties were properly positioned.
Bloomfield: Continued Strength at a More Accessible Price Point
Bloomfield continues to provide a more attainable entry point for buyers who want proximity to Montclair, convenient transportation and access to Essex County amenities.
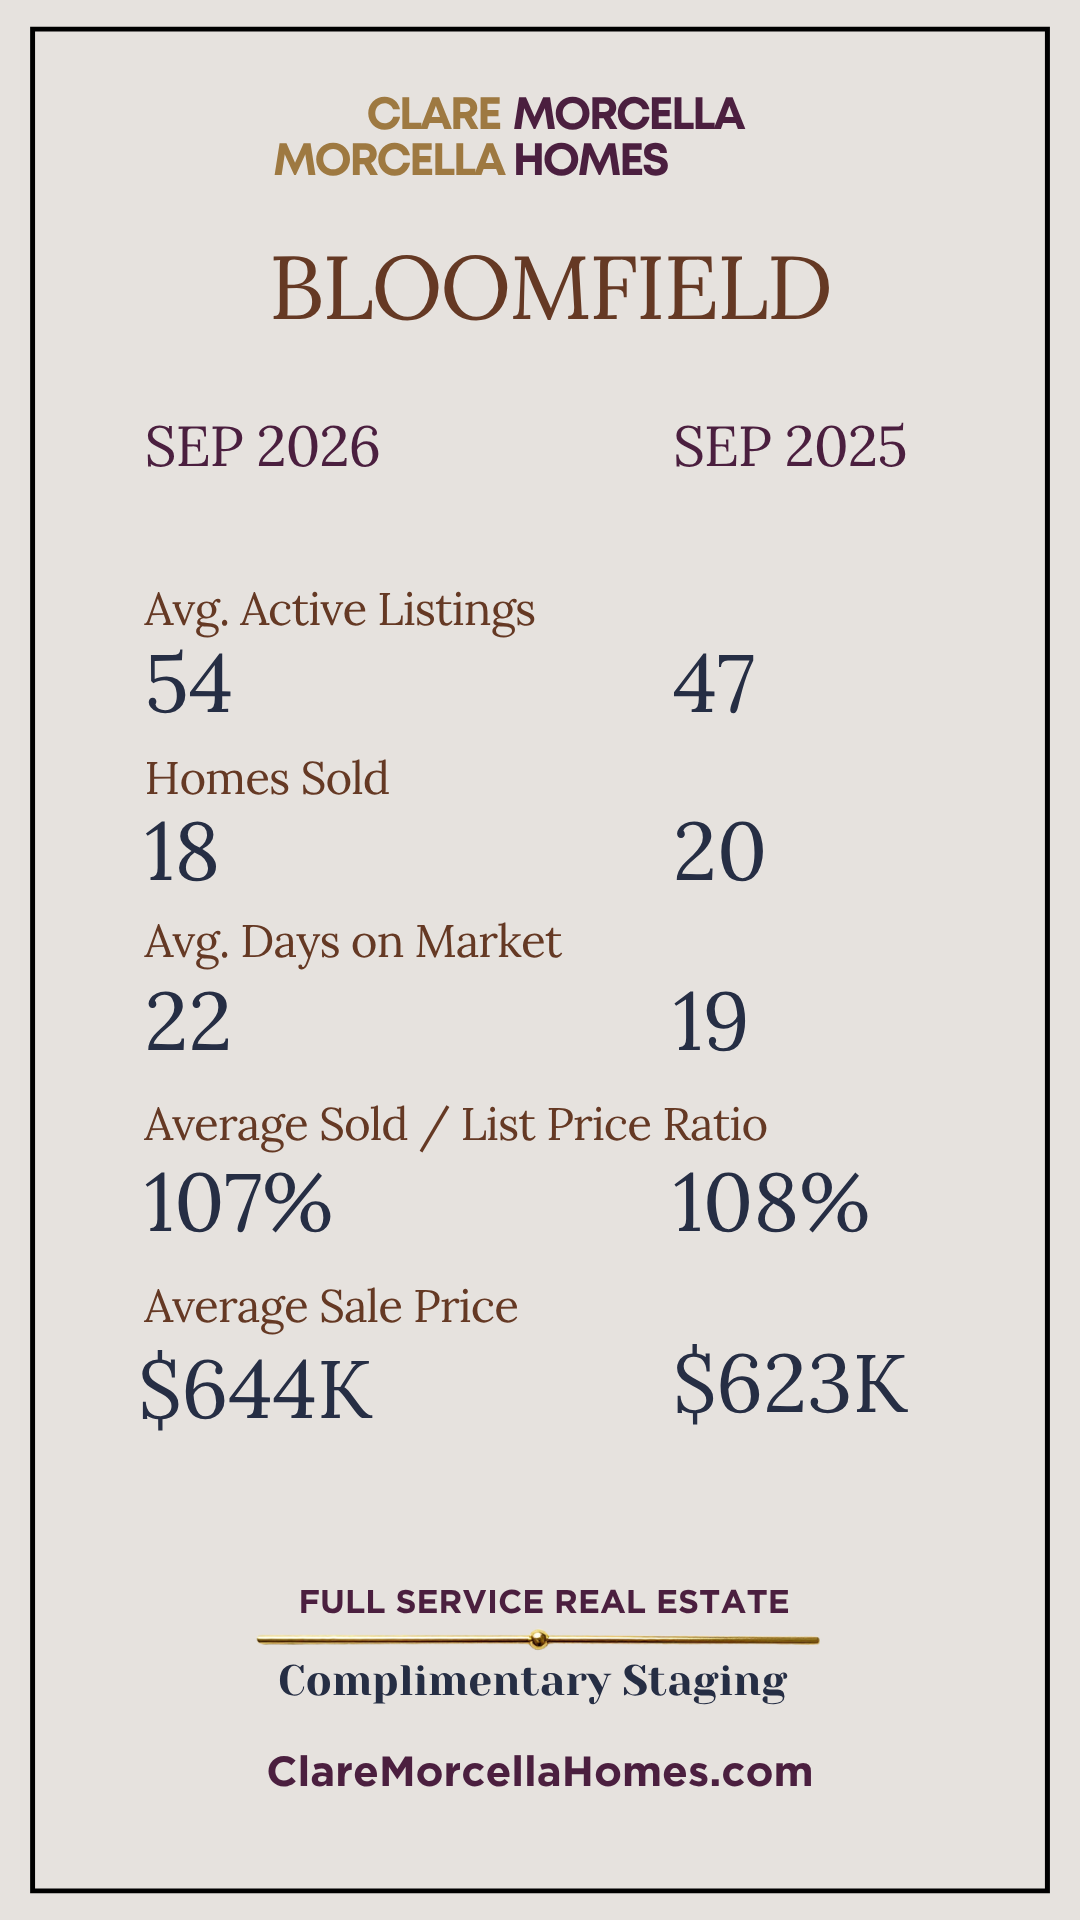
September’s figures included:
- 54 average active listings
- 18 homes sold
- 22 average days on market
- 107% average sale-to-list price ratio
- $644,000 average sale price
Compared with September 2025, the average sale price increased from $623,000 to $644,000. Inventory rose from 47 to 54 homes, while sales declined slightly from 20 to 18.
Homes took an average of three days longer to sell, and the sale-to-list ratio moved from 108% to 107%.
Compared with August 2026, when Bloomfield homes averaged approximately $672,000 and 110% of asking, September was somewhat less competitive. Nevertheless, homes continued to sell above asking on average.
Bloomfield’s results demonstrate that value-oriented markets can remain resilient even as buyers gain additional choices.
Short Hills and Millburn: Strong Luxury-Market Performance
The Millburn and Short Hills market segments produced some of September’s strongest year-over-year results.
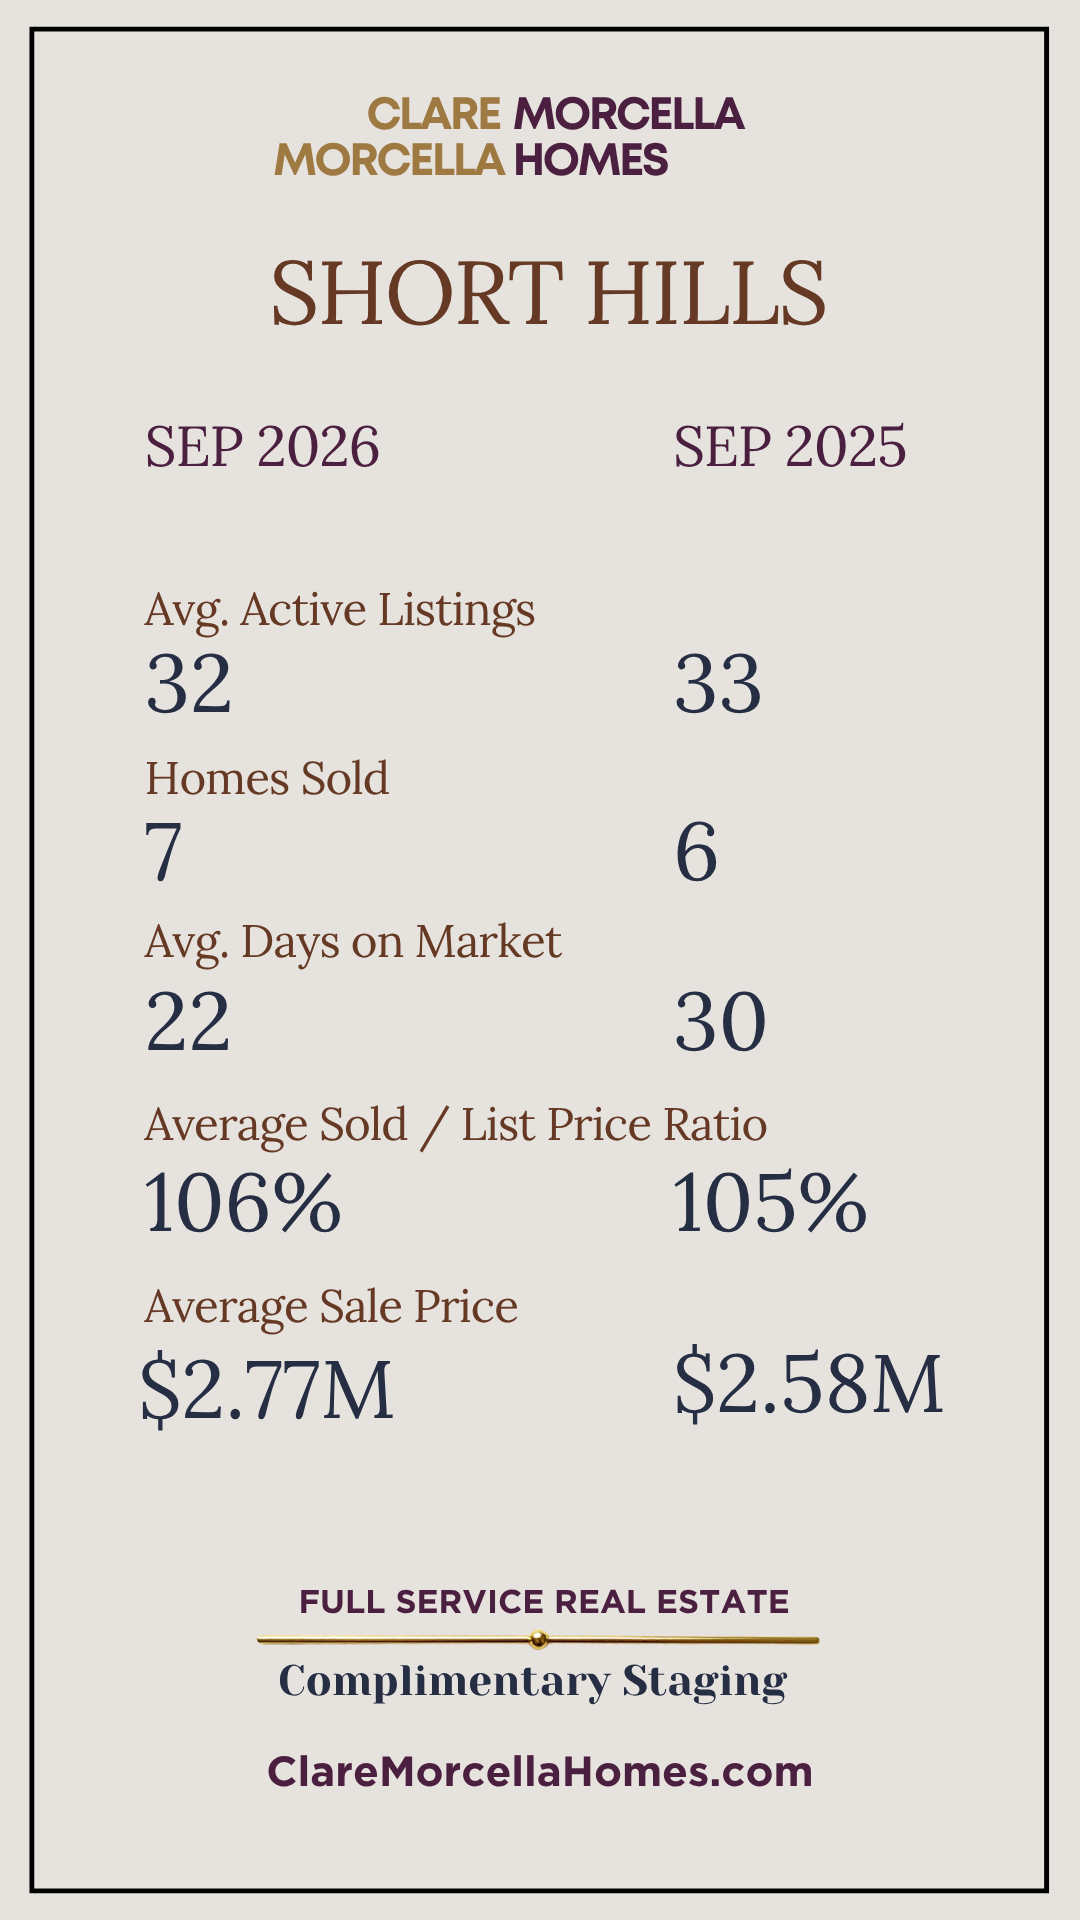
Short Hills
Short Hills recorded:
- 32 average active listings
- 7 sales
- 22 average days on market
- 106% average sale-to-list price ratio
- $2.77 million average sale price
The average price increased from $2.58 million in September 2025, while homes sold faster—22 days compared with 30. Inventory remained nearly unchanged, and the sale-to-list ratio increased slightly from 105% to 106%.
Compared with August, when the average sale price was approximately $2.83 million and homes averaged 108% of asking, the September numbers show a modest seasonal adjustment rather than a significant change in direction.
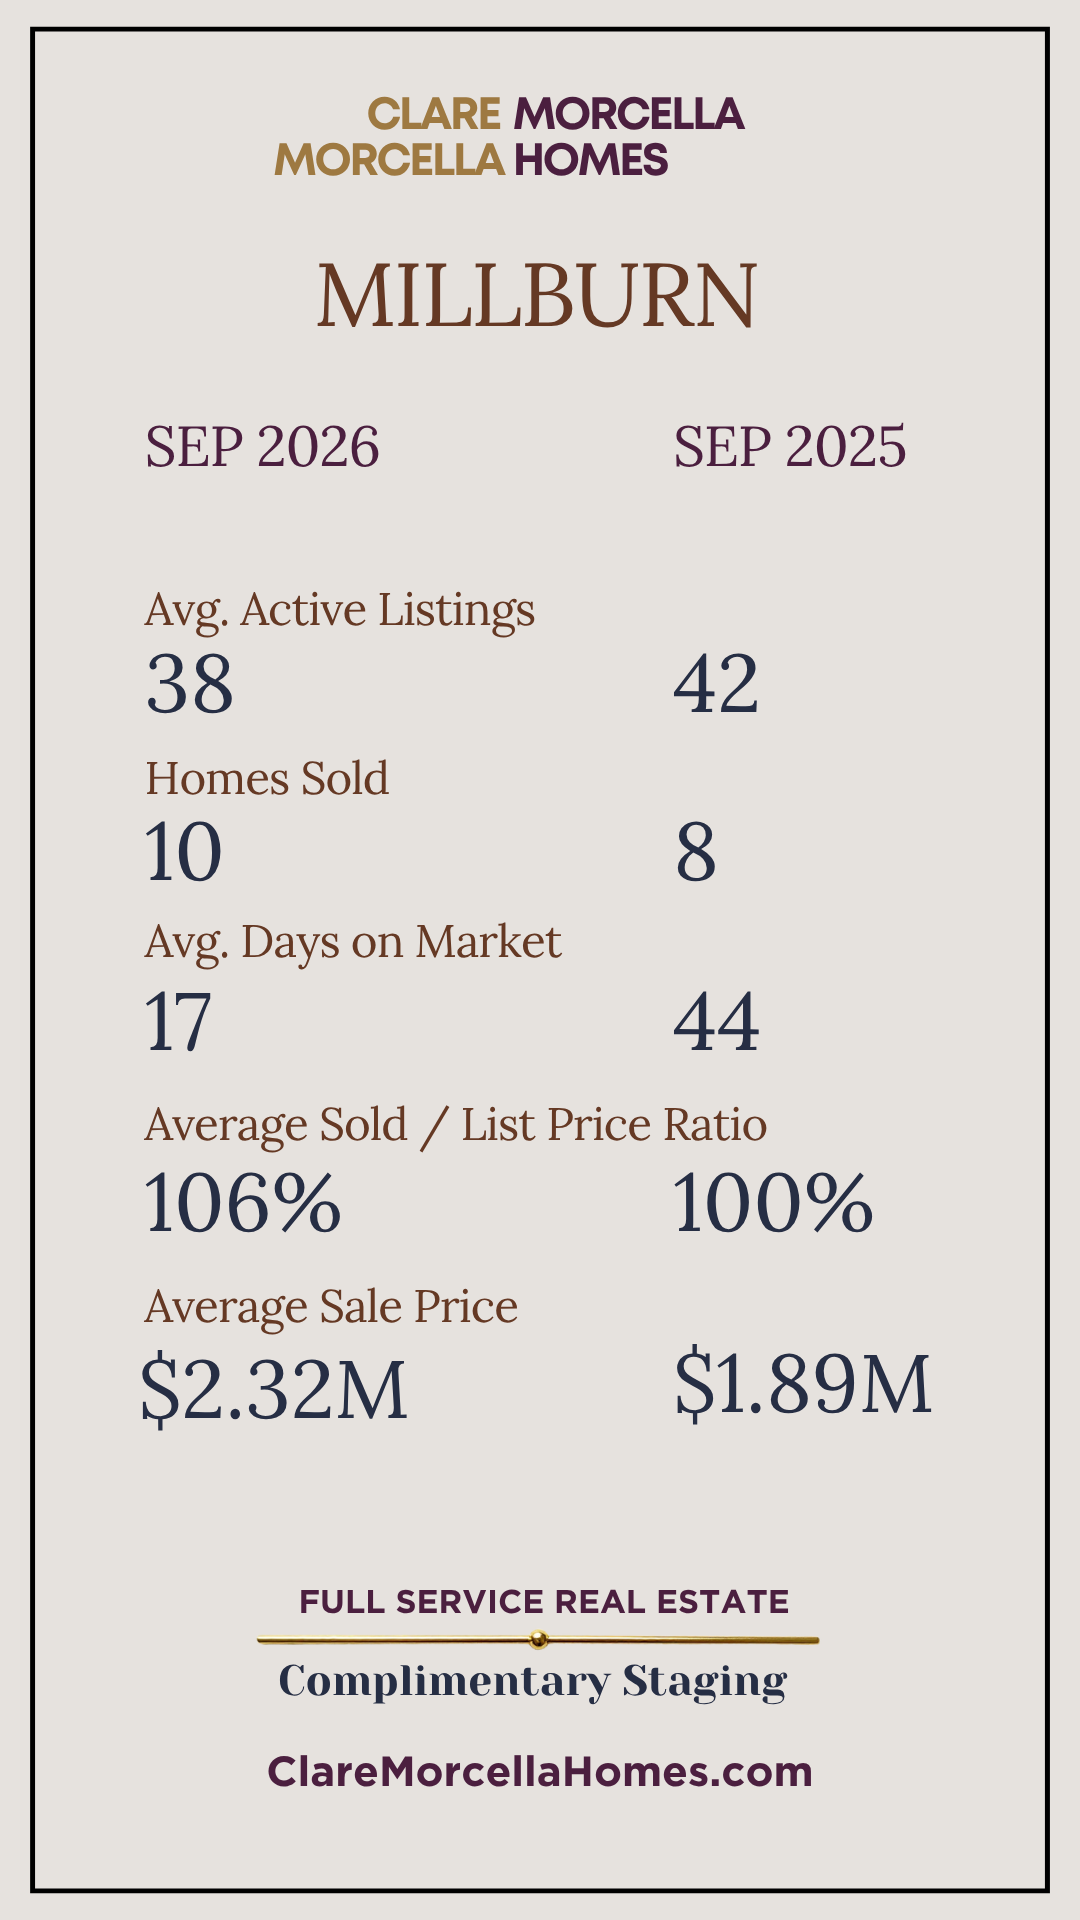
Millburn
Millburn recorded:
- 38 average active listings
- 10 sales
- 17 average days on market
- 106% average sale-to-list price ratio
- $2.32 million average sale price
Compared with September 2025, the average sale price increased from $1.89 million. Sales rose from 8 to 10, homes sold considerably faster—17 days compared with 44—and the average sale-to-list ratio increased from 100% to 106%.
Millburn’s results show that demand for well-positioned luxury homes remains strong. However, with relatively small monthly sales samples, one or two high-value transactions can have a substantial effect on the average price. The price figure should always be considered alongside market time, inventory and the types of properties that closed.
Summit: Faster Sales and Higher Prices, but Fewer Closings
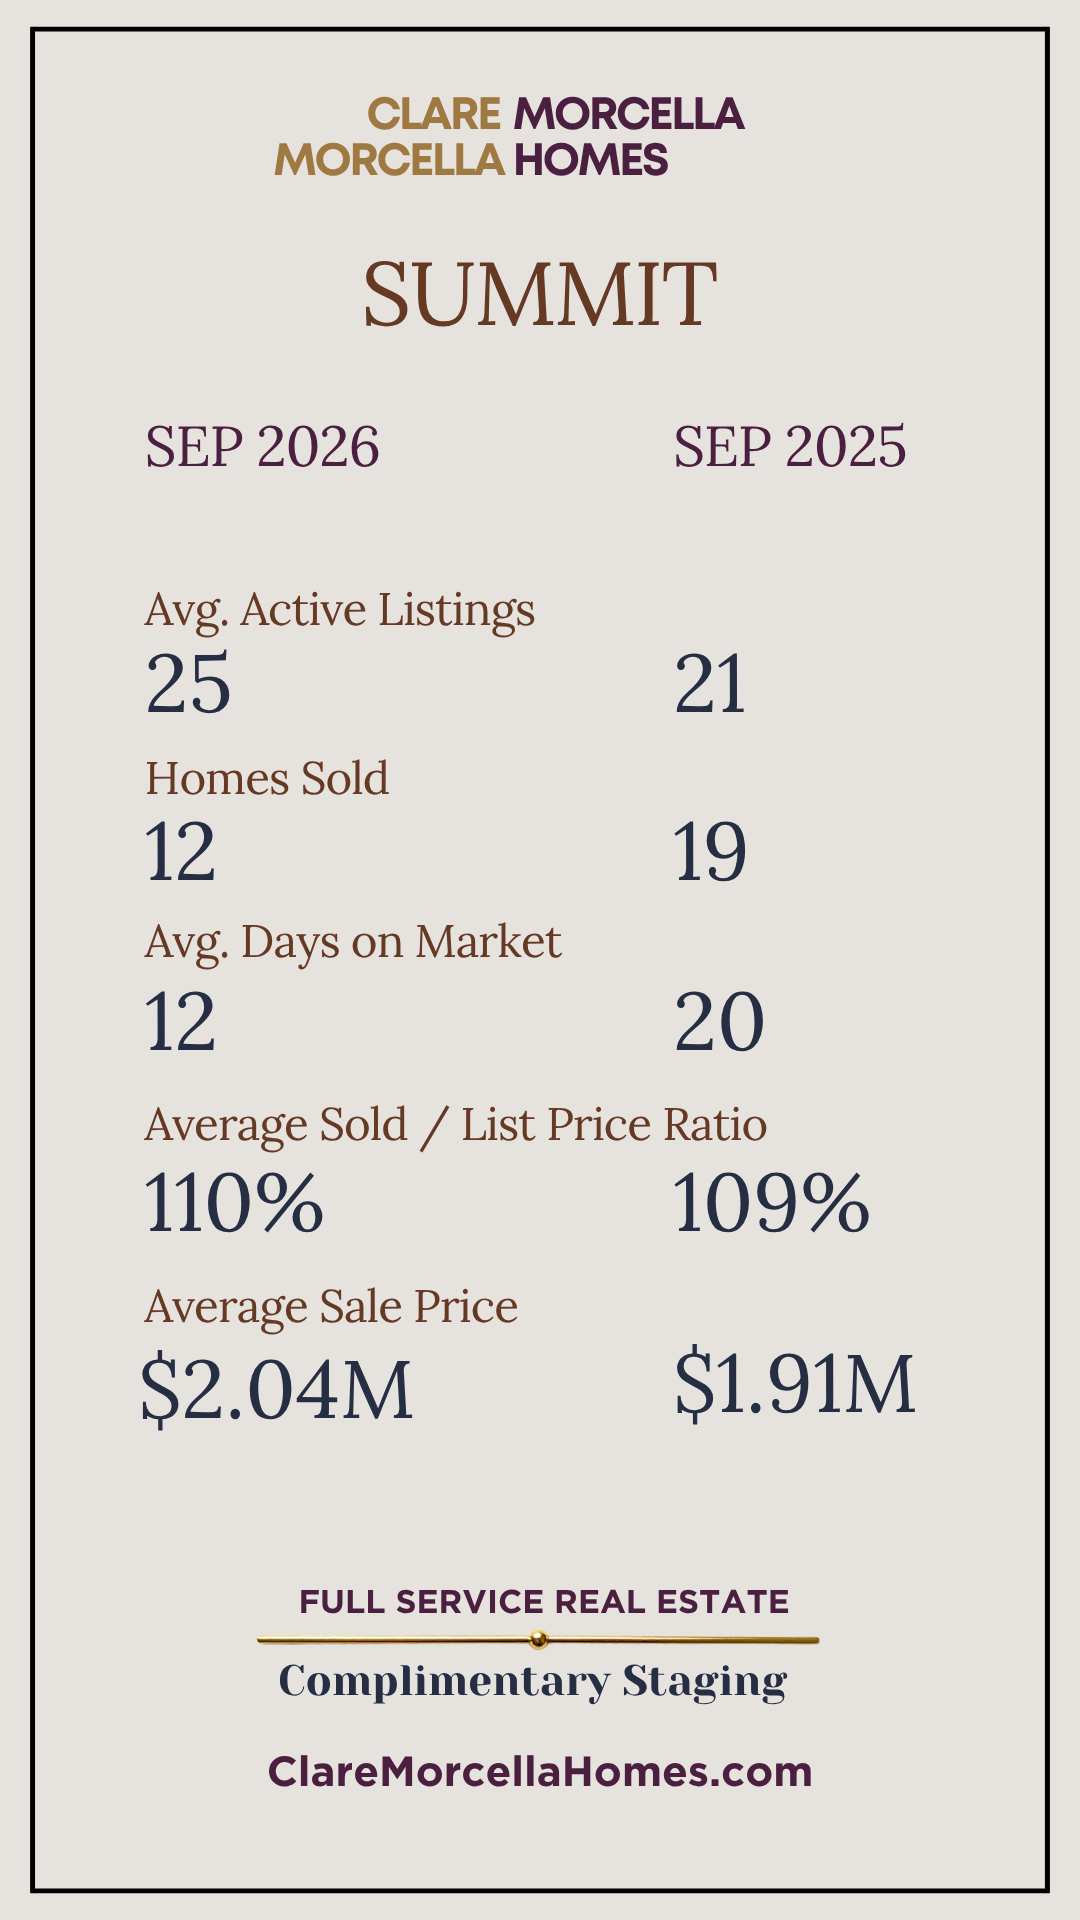
Summit presented a mixed but generally strong picture:
- 25 average active listings
- 12 homes sold
- 12 average days on market
- 110% average sale-to-list price ratio
- $2.04 million average sale price
Compared with September 2025, Summit had more inventory but fewer sales. Nineteen homes sold last September, compared with 12 this year.
Despite the lower transaction count, homes sold considerably faster—12 days compared with 20—and the average sale price increased from $1.91 million to $2.04 million. The sale-to-list ratio also improved slightly from 109% to 110%.
Compared with August’s $2.23 million average sale price and 113% sale-to-list ratio, September was less aggressive. Still, homes selling in only 12 days at an average of 110% of asking reflects meaningful buyer competition.
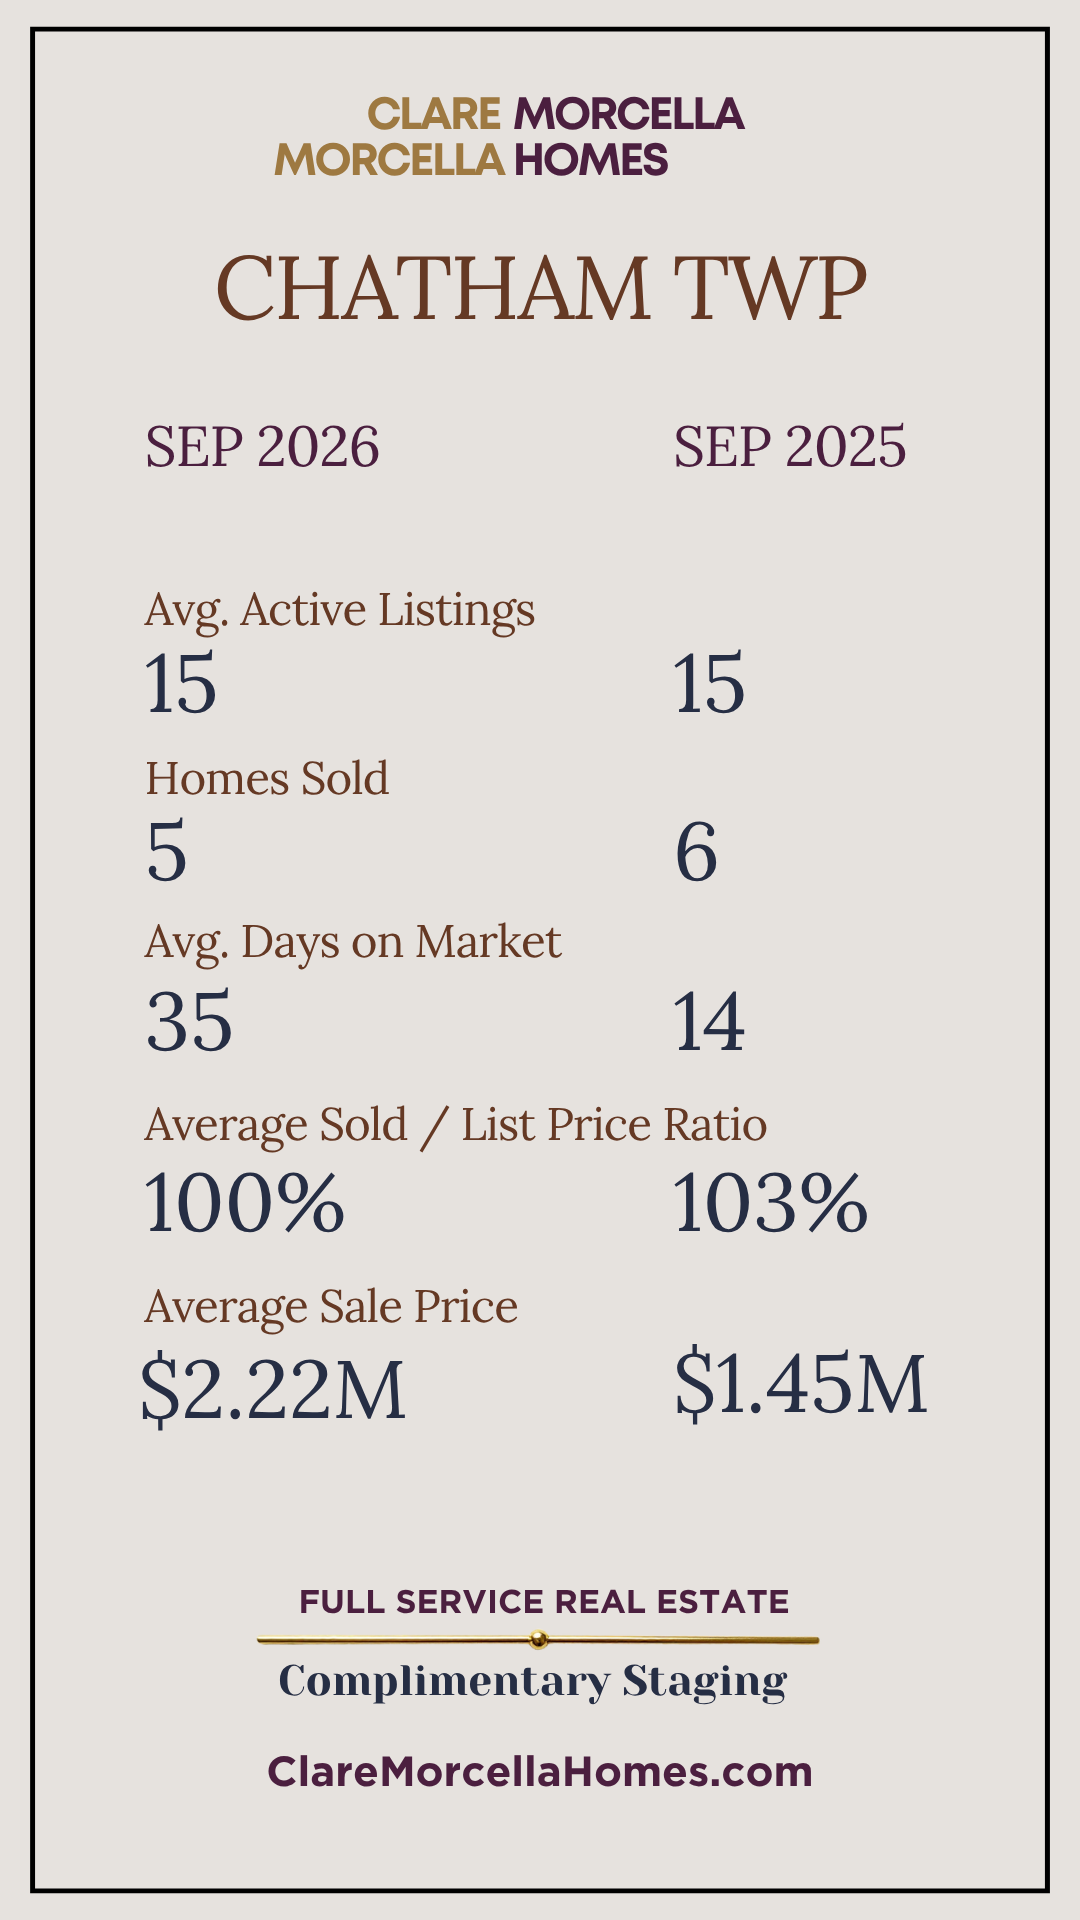
Chatham Township: Higher Prices, but a Noticeably Slower Pace
Chatham Township’s September numbers offer an excellent example of why average price alone does not tell the whole story.
September 2026 recorded:
- 15 average active listings
- 5 sales
- 35 average days on market
- 100% average sale-to-list price ratio
- $2.22 million average sale price
The average sale price was substantially higher than the $1.45 million recorded in September 2025. However, only five homes closed, making the average especially sensitive to the price mix of those individual sales.
At the same time, homes took considerably longer to sell—35 days compared with 14 last year—and achieved an average of 100% of asking rather than 103%.
The shift from August was also meaningful. August’s Chatham Township homes sold in an average of 12 days at 111% of asking, with approximately seven active listings. By September, inventory had increased to 15, market time had extended to 35 days and the average sale-to-list ratio had fallen to 100%.
The higher average sale price does not mean every Chatham home increased dramatically in value. It more likely reflects the particular properties that closed. The broader indicators suggest buyers gained leverage as inventory increased.
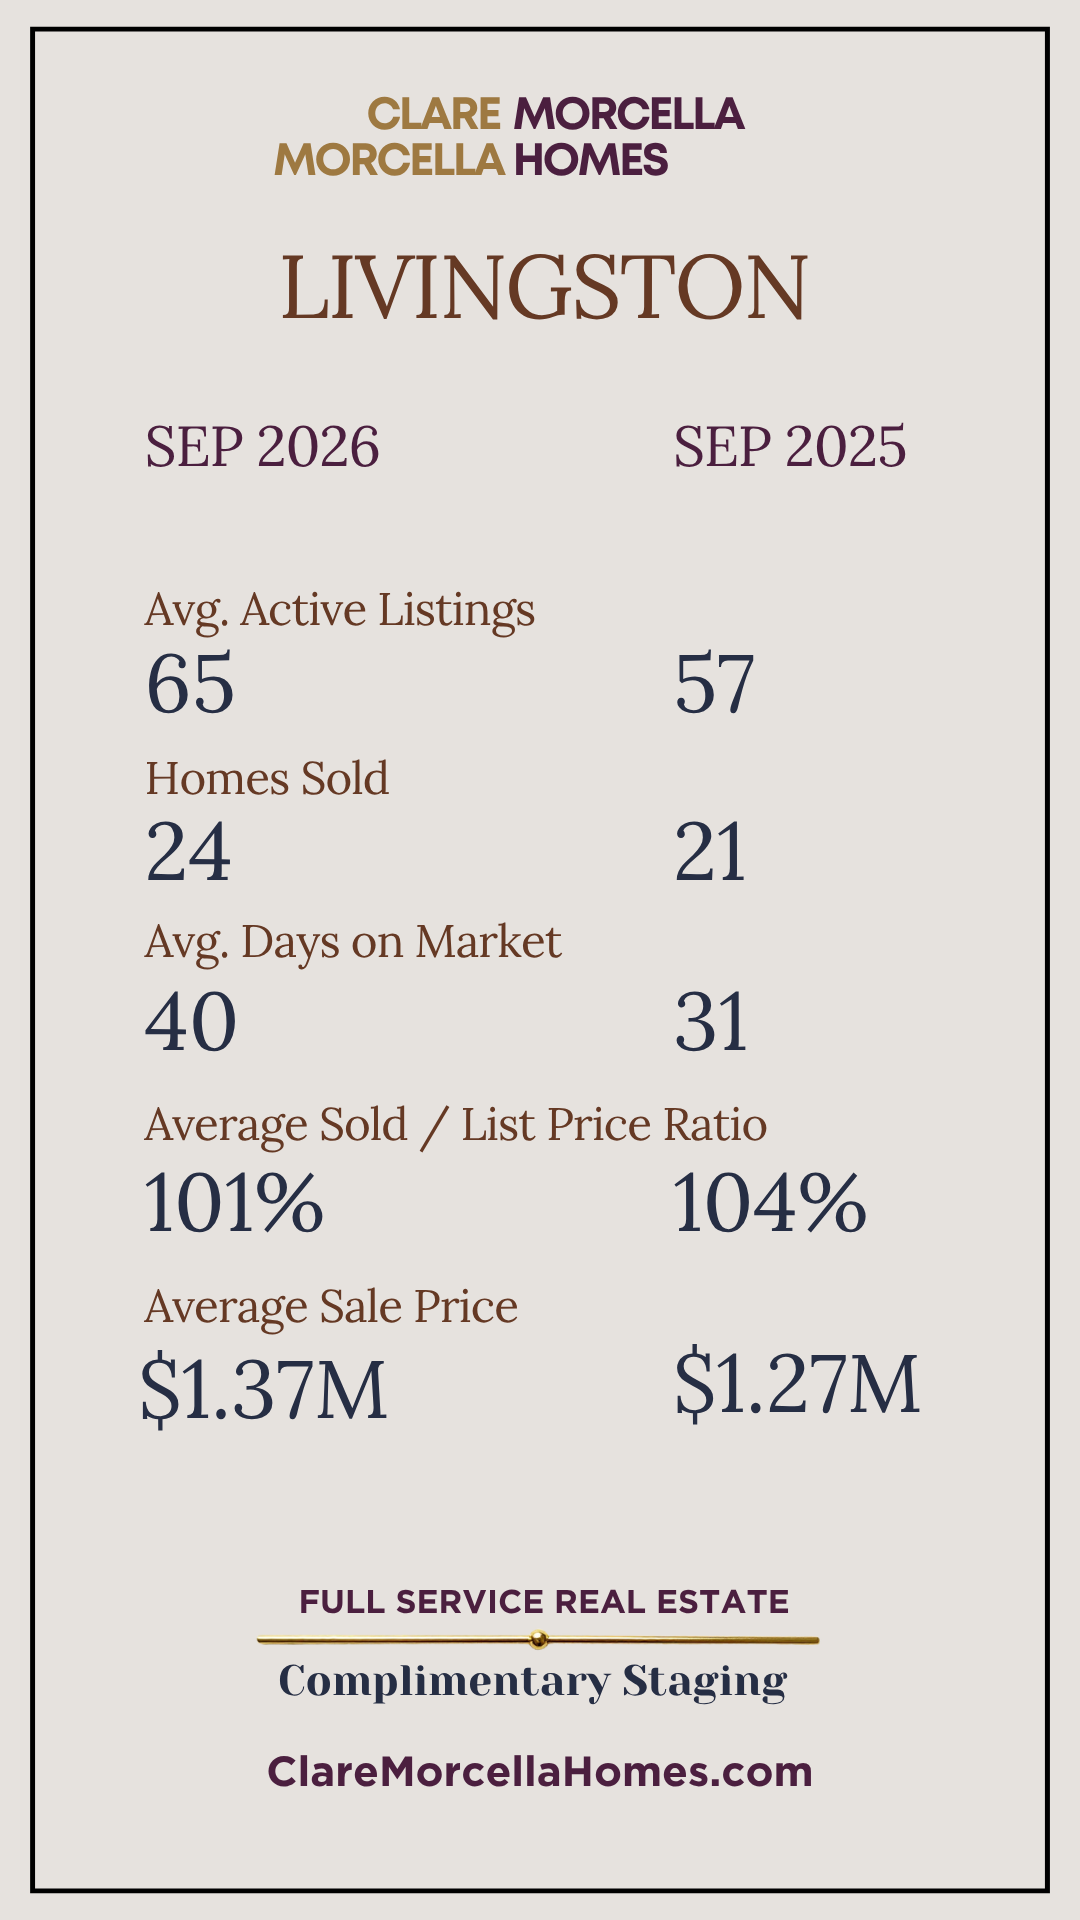
Livingston: More Listings and Longer Market Times
Livingston also moved toward a more balanced environment.
September 2026 reported:
- 65 average active listings
- 24 sales
- 40 average days on market
- 101% average sale-to-list price ratio
- $1.37 million average sale price
Compared with September 2025, inventory increased from 57 to 65 homes and sales rose from 21 to 24. The average sale price increased from $1.27 million to $1.37 million.
However, homes took longer to sell—40 days compared with 31—and the average sale-to-list ratio declined from 104% to 101%.
Livingston buyers appear to have gained more time and negotiating room, particularly when a home is not ideally priced or presented. Sellers can still achieve a strong result, but simply entering the market is no longer enough. Execution matters.
What September’s Numbers Really Mean
September did not produce one universal Northern NJ market trend.
Montclair experienced a substantial increase in inventory compared with August, accompanied by longer market times and smaller premiums above asking. Maplewood retained limited supply and fast sales. South Orange prices held relatively steady. Bloomfield continued to provide a more accessible alternative while still averaging above asking.
Millburn and Short Hills remained strong at the luxury end of the market. Summit moved quickly despite fewer sales. Chatham Township’s higher average price contrasted with longer market times and a sale-to-list ratio of 100%. Livingston offered buyers more inventory and greater negotiating opportunity.
These differences are exactly why broad national or statewide headlines have limited value when making a local real estate decision.
The relevant question is not simply, “What is the market doing?”
It is:
- What is happening in this town?
- In this neighborhood?
- At this price point?
- For this style and condition of home?
- And how are buyers responding right now?
Hyperlocal data provides the context necessary to answer those questions.
What This Means for Northern NJ Sellers
The fall market can still produce excellent results, but it is less forgiving than the spring market was.
Buyers now have more choices in several towns and are more willing to pass on homes that feel overpriced, poorly presented or in need of too much work. The strongest results are likely to go to homes that are carefully prepared, professionally staged, strategically priced and marketed to the right audience from the beginning.
Pricing from an outdated spring comparable—or assuming every home will generate multiple aggressive offers—can be costly.
The strategy must reflect current competition, current inventory and the specific buyer pool for the property.
At Morcella Homes, full-service real estate includes thoughtful home preparation, complimentary professional staging and design, strategic pricing, extensive targeted marketing and expert negotiation. Every part of the process is designed to strengthen the seller’s position and maximize the final result.
What This Means for Northern NJ Buyers
For buyers, the fall market may provide something that was scarce earlier in the year: options.
More inventory and less uniform competition can create time for more thoughtful decisions and, in some cases, greater negotiating flexibility. That does not mean every home will be negotiable. The best properties can still move quickly and command multiple offers.
Success depends on recognizing the difference between a home likely to attract immediate competition and one where the buyer may have leverage.
That requires more than access to listings. It requires current, neighborhood-specific insight, a clear offer strategy and an understanding of how comparable homes are actually performing.
Looking Ahead
As we move further into the final quarter of 2026, inventory and buyer response will be the two key indicators to watch.
If inventory continues to rise, buyers may gain additional choice and negotiating power. If attractive, well-priced homes continue to sell quickly, sellers will retain leverage in the most desirable segments of the market.
For homeowners considering a 2027 sale, this is an ideal time to begin preparing. The sellers who achieve the strongest spring results are often those who start making strategic decisions months before their homes reach the market.
The goal is not simply to know what happened last month. It is to understand what the numbers mean for the decision you are making next.

Source: Garden State Multiple Listing Service.
If you are considering buying or selling in Montclair or another Northern NJ commuter town, contact me for a personalized analysis of your home, neighborhood or target market.
Your Home Deserves a Smarter Strategy. Let Me Show You How.
Clare Morcella | Morcella Homes
Montclair & Northern NJ Real Estate Advisor
Top 1% Nationwide and #2 Ranked Agent in Montclair | RealTrends Verified